Showing posts with label R. Show all posts

Tuesday, 11 March 2014

Mapping UK Adland

I've been putting together a lot of advertiser spend data recently, for our own internal Tableau dashboards, and thought it might be fun to throw the dataset at R too and make something less functional but a little bit prettier.

These are contour maps showing the locations of UK advertisers spending more than £500k on TV, radio, print and posters last year. Darker equals more businesses in the area and I've deliberately dropped legends to avoid cluttering up the maps.

Huge thanks to the people behind R and the ggmap package, who are much, much cleverer than I am!


UK businesses spending more than £500k on advertising in 2013 (Click for bigger)


Focussing on England and Wales...


It's not all about London...


Nobody goes South of the River...


Monday, 25 June 2012

Joe Hart officially named Twitter's man of the match.

England vs. Italy, 24th June 2012...

88,142 tweets mentioning "England"...

Analysed for positive or negative sentiment and then used to rate each player's performance.

The result? Joe Hart was England's man of the match based on tweets that mentioned player names. Ashley Young was, erm, less good.

Instead of the usual static infographic, here's a Tableau dashboard! Don't forget to click on the different pages across the top. Go here for overall England ratings, player scores and interactive player performance over time.


A few interesting bits that popped out for me...
  • Rooney's performance was nowhere near his pre-match expectation (check his time-line)

  • We all got progressively more depressed about England as the game went on. Have a look at sentiment over time and compare the pre-game level with the decline over the next two hours.

  • We were happy to make half time and greeted the second half with a big COME ON ENGLAND! Then went back to getting steadily more depressed again.

  • Cole's been harshly treated for that penalty miss. He scores a low rating due to the large volume of negatives as England exit on penalties

  • Nobody tweets about poor old Lescott! That probably means as a centre back that you're getting the job done. I thought he had a good game.

If you want to see some methodology, it's the same as I did for England vs. Sweden.

Monday, 18 June 2012

Rating England vs. Sweden using Twitter

If you follow me on Twitter (why would you not? Don't answer that) you'll know I've been playing with R a lot recently. First attempts at pulling data from Twitter resulted in a word cloud I quite liked, but which an ex-colleague dubbed the "mullet of the internet". Thanks Mark.

This time, I've pointed R at Euro 2012. Specifically, I set R running from half an hour before kick off in the Group D England vs. Sweden game - 19.30 last Friday - with instructions to pull every tweet it could that contained the word "England".

The results? 78,045 England related tweets (excluding re-tweets), running from 19.30 to 21.15.

Let's see what we got. Grouping up the tweets into 5 minute intervals, here's overall volume.


We're averaging just under 2,300 tweets every 5 minutes. That's got to be enough to do something interesting with!

It's a bit easier to read if you colour the first and second half in red, with pre and post game and half time in grey.


OK, so lots of Tweets then. One of the cool things we can do with them is to split the tweets by sentiment; positive, negative or neutral. An example of a strong positive from the database would be:

"Well done and very proud of you. England may not have the most talented players but they played with guts, passion and heart #England" @ozzy_kopite

And negative (no points for grammar here either):

"Now lets watch england lose bcoz they use caroll!!! N the game will b bored!!! #damn" @Anomoshie

The sentiment algorithm isn't perfect so we're not going to push it too hard. I'm dumping any data about the strength of sentiment, tweets are either positive, negative or neutral and that's it.

If you'd like to know what kit I used to do all of this, please see the bottom of the post. I'm assuming most readers just want to jump to results, so here we go.

Keep the five minute time-slots and divide the number of positive tweets by the number of negative, to get a view on how cheerful Twitter was feeling about England during the game.


On average, there are 2.8 times as many positive tweets as negative. That will partly be down to the settings on the sentiment algorithm though and it's the movements we're really interested in.

Twitter was very positive in the lead up to kick off, but that didn't last long. Twenty minutes in, the balance of positive over negative had dropped from 4.1 to 2.2 as Sweden failed to roll over and let England hammer them. Then Carroll scored the opener...

In the second half, we can see a trough all the way down to 2.0 as Sweden take the lead and then a positive swing via England goals from Walcott and Welbeck. The game ends on a positive / negative sentiment value of 2.9. Well played lads.

Come to think of it, well played which lads? We've got loads of mentions of the players in this database too, so let's see who Twitter thinks had a good game.

Height of the bars is positive / negative sentiment and width is volume of tweets (some players like Lescott generate really low volumes so don't take their rating too seriously.) I've restricted the database just to tweets that took place  during the first or second half. If you were slating Carroll before the game, we're not interested in your opinion here!


Carroll comes out man of the match, both in terms of sentiment and volume of tweets. There's a definite break between the players who did best - Carroll, Welbeck, Gerrard, Hart and Walcott - and everyone else. The overall England rating never goes negative (below 1,) and none of the players' ratings do either, although Johnson tries hardest, which may be a reflection of his own-goal.

Finally, let's see how the player ratings fluctuated during the game. Sentiment on top. Volume of tweets below. This doesn't work so well for players with low numbers of mentions in tweets but you can see it works for Andy Carroll. That huge volume spike is his goal.


One more; here's Gerrard. Game of two halves for the Liverpool midfielder and his rating dropped significantly after half time.


Want to see another player? Here they are - knock yourself out. If you select "False" it will show totals for tweets that either don't mention a player, or mention more than one. The chart is a bit squashed below to fit in with the Wallpapering Fog template. For bigger, go here.


Tools:

Tweet database pulled using R, R Studio and TwitteR. Sentiment analysis using the R 'Sentiment' plugin. Cleaned up a little in Excel and then all the charts are Tableau.

Tuesday, 14 February 2012

Losing touch... or why Excel and VBA won't cut it any more

Thinking through this post is making me feel old. There's going to be a lot of 'in my day' type reminiscing and I'm only 34. It's all this new fangled technology that's doing it. The world's changing fast. I hate people who say that the world's changing fast, but this time it's true.

I got my first proper job twelve years ago this month, as a junior analyst with a small econometrics consultancy and although the statistical techniques I use are roughly the same as back then, I've started to realise that our software tools are going through a revolution. Hence this post - I'd like to stop and look around for a minute to see what's happened.


Fairly quickly after starting that first job, I discovered that data processing in Excel was a hell of a lot faster and easier if you learned Visual Basic for Applications (VBA), so I did. With the help of our IT department and a lot of practice, I got pretty good and it went a long way to getting me promoted because I could make dull work happen quickly, make other peoples' lives easier and build some nice interactive spreadsheet tools for our clients.

Up until fairly recently, if an aspiring analyst asked what they should do to get ahead at work, I'd say get good in Excel. Really good. And learn VBA. The first bit's still true, but VBA? Not so much.

The trouble is, VBA's getting left behind. It's still worth knowing some, but it's nowhere near as important as it was, because creating tools in Excel is nowhere near as important as it used to be. It's also not a good gateway into other types of programming because as a language, its structure is out of date. Although some programming skills are always transferable, you need to pretty much start again when you want to learn another language after VBA.

There's also a problem for the next generation in that they need to get luckier with where they start work to get exposed to the right kit. Everybody uses Excel, so at some point, every inquisitive analyst ends up in VBA. The new generation of tools probably won't be on your PC unless you decide to put them there.

So, you're ambitious and you're six months into your first analyst's role. What do you learn now? Even if your company doesn't use these, this is where I'd start. It's the kit I'm using (and still learning) and it's free, so you can pick it up as a CV booster without buying expensive software. If you're a junior analyst reading Wallpapering Fog then I hope this list might help. You also have excellent taste in blogs, so well done on that.

Let's look at what you need to be able to achieve, as an ambitious analyst...

Collect data

This is much more important than it used to be. Ten years ago, if you didn't have the dataset and the client didn't have it, then you'd have to buy it. Either way, almost certainly it would turn up on a spreadsheet or csv file. You often needed VBA macros to clean it up and make a tidy spreadsheet.

Now, some of your data will arrive like that (so a few simple macros are still handy) but very often, you'll want to trawl the web for it. Senior staff love it when you tell them you can scrape the data that they want off the web, automatically and for free. It will make you famous.

You could learn a proper programming language, but we're statisticians not programmers, so unless you want to do that for yourself anyway, then you need a tool which is designed specifically to work with statistical data. For analysts, R is the new VBA. It's free and it's well worth the effort that it takes to learn.

Learning R gives you the same head-start that VBA gave ten years ago. You don't need to buy new software (just like VBA, which was always in your copy of Excel anyway) and it will let you do things that are otherwise the preserve of IT, which should be the ambition of any good analyst. If you need IT to sort data out for you, then you've failed.

If you get good in Excel and good in R, you'll be in a promising place from which to get your data assembled, which brings me onto...

Process data

Excel worked well when data came in thousands of rows. It still works well for lots of things and the latest versions have finally broken the 65k row limit, but there's a problem. If you throw lots of data at Excel - properly lots - you'll break it. Or wait forever for it to calculate. Excel isn't designed for processing databases and that's what we're working with now.

R can do it, but you need a good level of SQL too, even if it's just to make Access work properly. SQL turns up everywhere and it's easy to learn.

To be fair, you've needed SQL for ages but I keep coming across analysts who aren't comfortable using it. You can't get away with that any more.

Build your models

Excel for the simple ones if you like - it's still a very powerful bit of software. For more complex statistical models, you need something else. Again, R is good. Some of the older competition like SAS (which is another reason to get a good SQL grounding) is starting to look very dated. It's also hugely expensive, particularly when compared to open source.

There's no way I'd adopt SAS now and it's being kept afloat by a legacy of systems embedded in big firms. If you end up using it, fine, but don't learn it unless you have to.

I'd go with R again. And I have.

Make some output


The days of the interactive Excel workbook, emailed to a client, are over. Or rather, they're not quite but they should be and soon will be.

You need to be able to make good looking charts and output in Excel (start here) so that you can illustrate your PowerPoint decks because unfortunately, PowerPoint is still an essential tool to know.

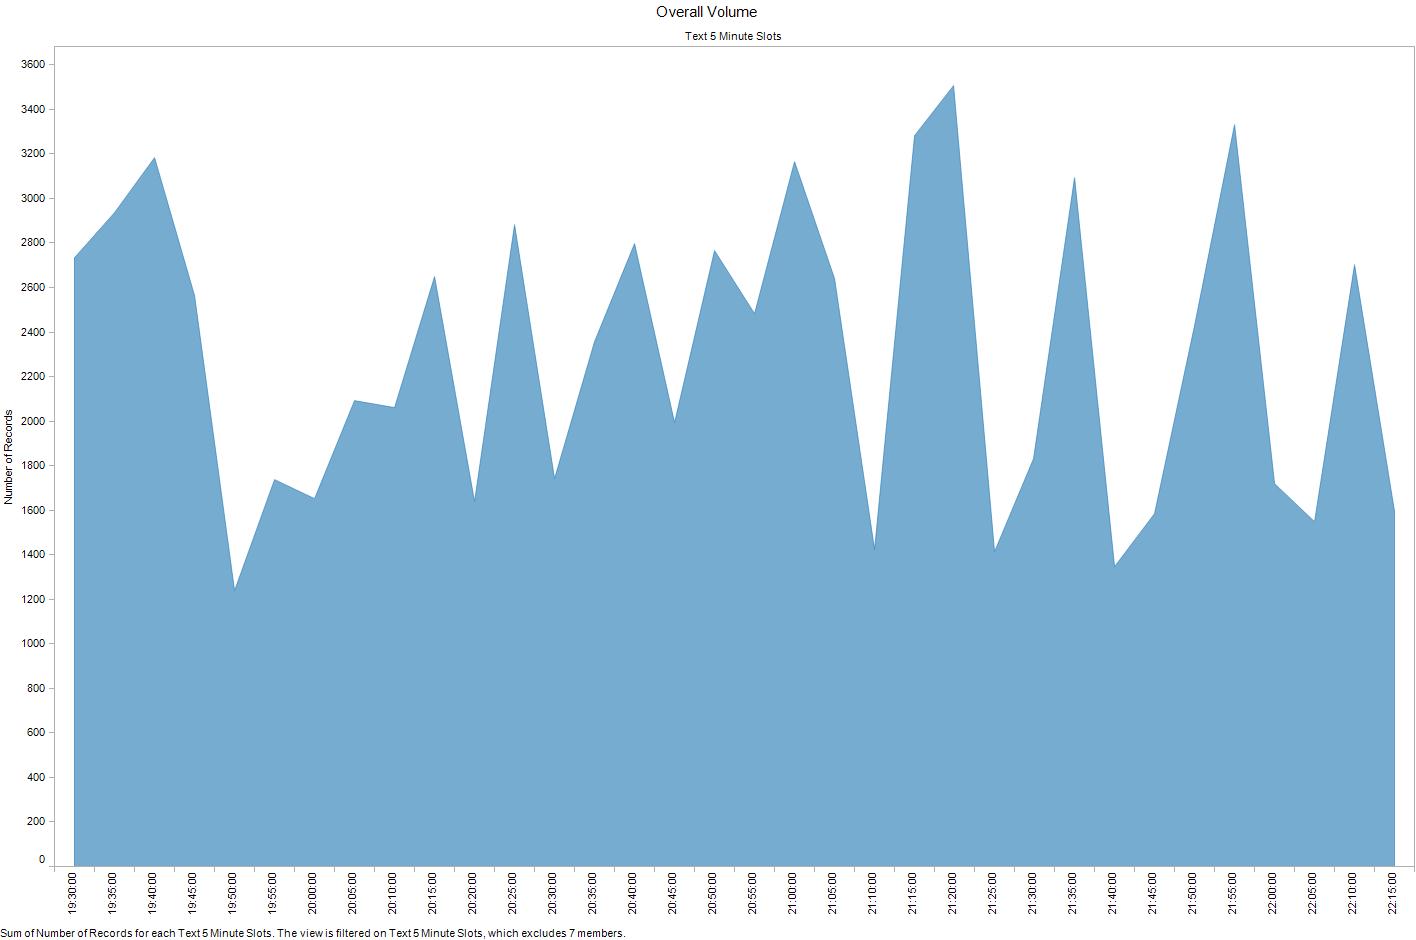
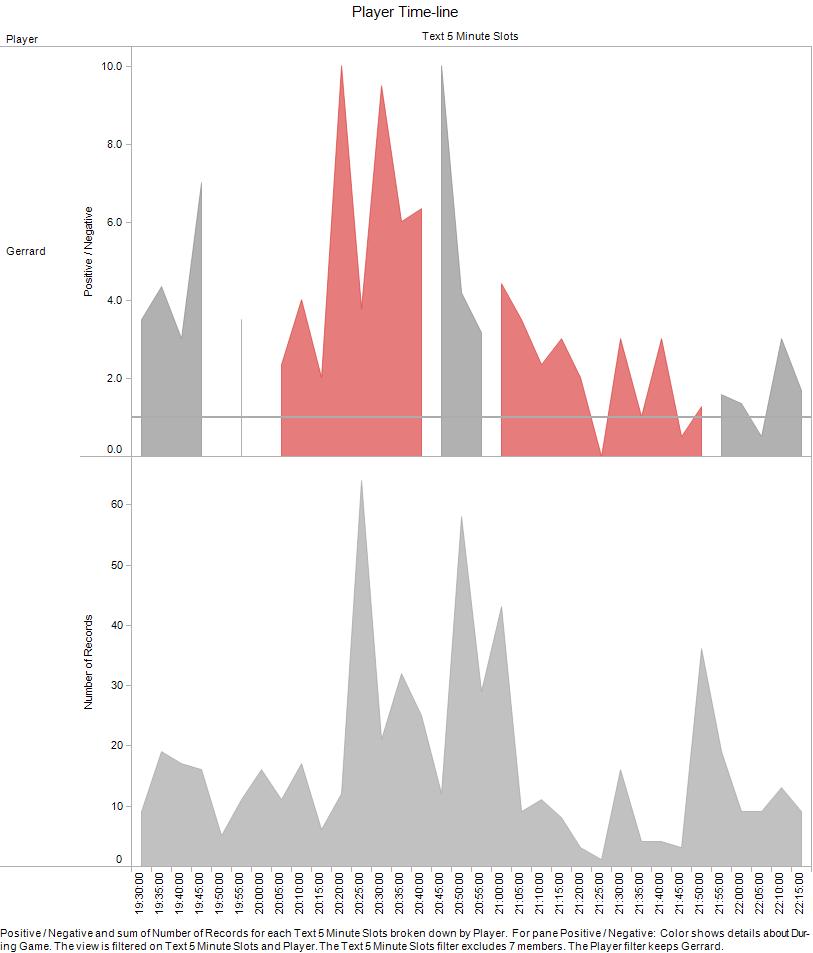
For interactive output, you want dashboards. There's only one bit of kit to learn for the moment and that's Tableau. If you can't persuade your company to buy you a copy, then get the free version and have some fun publishing to Tableau Public. Give it a couple of years and there are going to be some exciting roles around for people who can do good things with this piece of software.


So there you go. Learn a few macros by all means and definitely get very good with the front end of Excel, but take it from someone who's invested a lot of time in VBA and never uses it any more, there's a new world of software coming and you need to learn it. What worked ten years ago, won't cut it in another five.

The scary thing is, that means old buggers like me need to learn a load of new kit, and quickly. Back to the books...

Tuesday, 20 January 2009

SAS in trouble?

I'm going to stick my neck out here about the piece of software that drives a lot of marketing analysts' work.

SAS is the industry standard software for analysing big databases and, in all honesty, it should be much better.

The fundamental structure for SAS was put together in 1966 - 1968, with SAS Institute being incorporated in 1976 and the problem today is that it feels like a piece of software that has been built up over time. It also feels like the core of SAS was never designed with all it does today in mind, so new features have been bolted onto older features as the need for them arose.

It's horrible to code for SAS. There's no inline error checking, no auto suggest and the way that SAS Macros work is counterintuitive if you've got any other programming experience. To cap it all off, features added at different times over the life of SAS have subtly different programming syntaxes, so you have to learn individually how every procedure works - it's not enough to learn the basic structure of the language.

Apart from being the industry standard, I say SAS should be much better because it costs £4,300 per seat, per year (ignoring multiple licence discounts.) That's a hell of a lot of money for a piece of analytical software - almost the same as ten copies of Office 2007 Professional. And once you buy Office, you own it for life.


SAS could shortly be in a lot of trouble. Data analysis is a perfect market for Open Source software, because so many people will have a genuine interest in creating it. There's a large pool of analysts and programmers (including a lot of academic researchers) who will be happy to add the features that they need and then make them generally available to everyone else.

R is an odd name for a piece of software that, over the last 6 months, has been mentioned to me by analysts and by clients as a potential SAS replacement. Download it. It's free and it's very, very good.

It won't replace SAS for everybody yet. Banks for example, have loads of legacy built up in SAS and need the backup and support of a multinational software company. For many others though, R is being looked at as a genuine SAS replacement.

This NY Times article is a really good read and has an interesting quote from SAS, regarding R.

“I think it addresses a niche market for high-end data analysts that want free, readily available code," said Anne H. Milley, director of technology product marketing at SAS. She adds, “We have customers who build engines for aircraft. I am happy they are not using freeware when I get on a jet.”

The thing is, most data analysts don't build jets. They do day-to-day tasks like financial reporting and creating customer segmentations.
When Google and Pfizer publicly admit to using R, I think it's time for SAS to worry. R has also gained a strong hold among academic researchers, which means the next generation of graduates joining the industry will know how to use it rather than (or as well as) SAS.

If SAS doesn't get its act together and produce some software that is £4,300 better than R, they're going to lose a lot of customers. And you know what? Most of those customers won't be sorry to see it go.