I blame Wordle. It's not fair to blame Wordle, but marketing's obsession with infographics got well out of hand at some point and I think it was around the same time that pretty word clouds came within reach of every bored account manager with a slide to fill.

I actually like Wordle a lot, so on second thoughts, maybe we should blame the infographic's leap to fame on marketing's discovery of Wordle rather than the tool itself, which has been around since 2008. A quick check of Insights for Search shows that the world went infographic mad a bit later than that, starting in 2009-2010.

That growth line really isn't slowing down is it?
In case you hadn't guessed yet, this post is developing into a rant about infographics. To be more precise, infographics as they are used in marketing. I'm a little concerned though, that I may have just used an infographic to illustrate my point. Except that I'm pretty sure that's not what the image above is. It's a chart. If you're being pretentious, it's a data visualisation.
Data visualisations have a purpose; they exist to communicate data more effectively than text could. But could they still be the same thing as infographics? Maybe infographic is just short-hand for data visualisation?
Here's what Wikipedia thinks an infographic is...
I really like the idea of the infographic as a sign. It differentiates it from a data visualisation and gives it a purpose. You could list all of the exits on this roundabout, with a paragraph for each that describes where they go, but you'd cause an accident as people tried, at 40mph, to read what you'd written. Infographics - by the Wikipedia definition - are useful to communicate a lot of information at a glance.
Let's be honest though, marketing infographics don't often look like that road sign. In marketing and journalism at least, the Wikipedia entry is out of date and the infographics we see today are a very long way from doing that job.
Let's pick on the IAB. That's not really a fair thing to do either, but they've been known to publish infographics and yesterday, they published this one.

Now that's a marketing infographic! Much more like it. Lots of charts all blended together into one big image and pretty typical of what you can see shared far and wide on Twitter every day.
It's quite pretty.
Probably took quite some time to draw.
My question is why draw it? Other than being link-bait for all those Google searches, what is an image like this for? Maybe it's art? Then it wouldn't need to be for anything, but I don't think it's art.
It needs a purpose, but I can't work out what its purpose is. For the time it takes to make one of these, it needs to be better at communicating than writing a short article and illustrating it with charts, but it just isn't. Infographics like this let you throw unstructured data at your audience (in a pretty format) in the hope that they'll draw some insights of their own from it. You're hoping that your audience will do the analysis for you.
In all honesty, I think this is what's been responsible for the infographic explosion. Facts are easy to get your hands on. They're everywhere. Original insight and analysis is hard and that makes the infographic perfect blog fodder. Take any topical subject, plus a bit of Googling for some relevant numbers, plus a few hours in Adobe Illustrator and you've got yourself some high grade link-bait.
Contrast the infographic above, with this lovely piece of data visualisation from The Guardian.

The Guardian's work makes a vast number of tweets more comprehensible than they would have been if you'd just thrown raw data about them at the viewer. The infographic on the other hand, throws large amounts of almost-raw data at the viewer.
Comparing between these two is undoubtedly unfair, as one is the product of a hell of a lot more work, but what's important for me is the scope of what they're trying to achieve. Only one attempts to aid your understanding of a subject. And only that one is worth your time and effort to decipher.
Feedback on this article from The Register, which recently started dabbling in infographics (the modern 'throw a lot of data at the page and see what sticks' versions) make me think that I'm not alone, but maybe you like the current direction? Have you seen any marketing infographics that you still find useful and refer back to? That did a better job than simply writing an article would have? I'd love to hear about them. Somebody's generating all those Google searches too, so if you're a sucker for an infographic, what is it about them that's so appealing?
Right now, the word infographic to me means "presenting data in a pretty format that makes it difficult to use" and until they go back to following that Wikipedia definition, I'll be steering well clear.

I actually like Wordle a lot, so on second thoughts, maybe we should blame the infographic's leap to fame on marketing's discovery of Wordle rather than the tool itself, which has been around since 2008. A quick check of Insights for Search shows that the world went infographic mad a bit later than that, starting in 2009-2010.
Google searches for "infographic"

That growth line really isn't slowing down is it?
In case you hadn't guessed yet, this post is developing into a rant about infographics. To be more precise, infographics as they are used in marketing. I'm a little concerned though, that I may have just used an infographic to illustrate my point. Except that I'm pretty sure that's not what the image above is. It's a chart. If you're being pretentious, it's a data visualisation.
Data visualisations have a purpose; they exist to communicate data more effectively than text could. But could they still be the same thing as infographics? Maybe infographic is just short-hand for data visualisation?
Here's what Wikipedia thinks an infographic is...
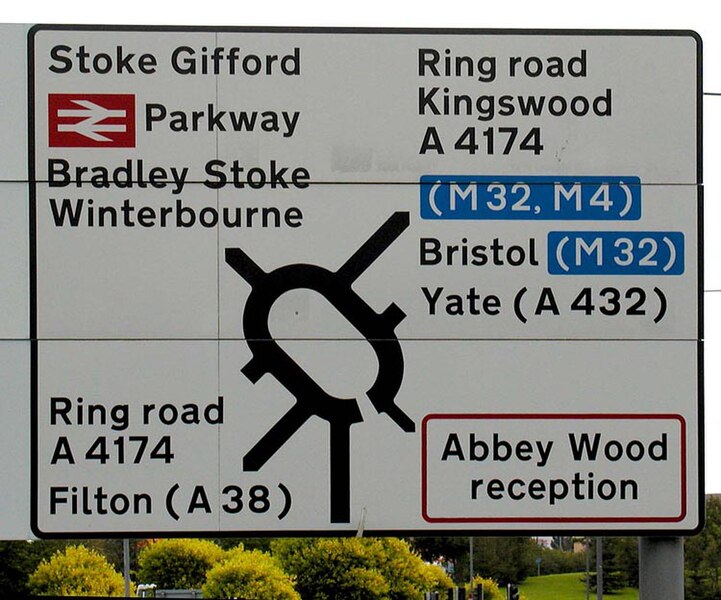
"Information graphics or infographics are graphic visual representations of information, data or knowledge. These graphics present complex information quickly and clearly, such as in signs, maps, journalism, technical writing, and education. With an information graphic, computer scientists, mathematicians, and statisticians develop and communicate concepts using a single symbol to process information."
I really like the idea of the infographic as a sign. It differentiates it from a data visualisation and gives it a purpose. You could list all of the exits on this roundabout, with a paragraph for each that describes where they go, but you'd cause an accident as people tried, at 40mph, to read what you'd written. Infographics - by the Wikipedia definition - are useful to communicate a lot of information at a glance.
Let's be honest though, marketing infographics don't often look like that road sign. In marketing and journalism at least, the Wikipedia entry is out of date and the infographics we see today are a very long way from doing that job.
Let's pick on the IAB. That's not really a fair thing to do either, but they've been known to publish infographics and yesterday, they published this one.

Now that's a marketing infographic! Much more like it. Lots of charts all blended together into one big image and pretty typical of what you can see shared far and wide on Twitter every day.
It's quite pretty.
Probably took quite some time to draw.
My question is why draw it? Other than being link-bait for all those Google searches, what is an image like this for? Maybe it's art? Then it wouldn't need to be for anything, but I don't think it's art.
It needs a purpose, but I can't work out what its purpose is. For the time it takes to make one of these, it needs to be better at communicating than writing a short article and illustrating it with charts, but it just isn't. Infographics like this let you throw unstructured data at your audience (in a pretty format) in the hope that they'll draw some insights of their own from it. You're hoping that your audience will do the analysis for you.
In all honesty, I think this is what's been responsible for the infographic explosion. Facts are easy to get your hands on. They're everywhere. Original insight and analysis is hard and that makes the infographic perfect blog fodder. Take any topical subject, plus a bit of Googling for some relevant numbers, plus a few hours in Adobe Illustrator and you've got yourself some high grade link-bait.
Contrast the infographic above, with this lovely piece of data visualisation from The Guardian.

The Guardian's work makes a vast number of tweets more comprehensible than they would have been if you'd just thrown raw data about them at the viewer. The infographic on the other hand, throws large amounts of almost-raw data at the viewer.
Comparing between these two is undoubtedly unfair, as one is the product of a hell of a lot more work, but what's important for me is the scope of what they're trying to achieve. Only one attempts to aid your understanding of a subject. And only that one is worth your time and effort to decipher.
Feedback on this article from The Register, which recently started dabbling in infographics (the modern 'throw a lot of data at the page and see what sticks' versions) make me think that I'm not alone, but maybe you like the current direction? Have you seen any marketing infographics that you still find useful and refer back to? That did a better job than simply writing an article would have? I'd love to hear about them. Somebody's generating all those Google searches too, so if you're a sucker for an infographic, what is it about them that's so appealing?
Right now, the word infographic to me means "presenting data in a pretty format that makes it difficult to use" and until they go back to following that Wikipedia definition, I'll be steering well clear.