Analysed for positive or negative sentiment and then used to rate each player's performance.
The result? Joe Hart was England's man of the match based on tweets that mentioned player names. Ashley Young was, erm, less good.
Instead of the usual static infographic, here's a Tableau dashboard! Don't forget to click on the different pages across the top. Go here for overall England ratings, player scores and interactive player performance over time.
A few interesting bits that popped out for me...
Rooney's performance was nowhere near his pre-match expectation (check his time-line)
We all got progressively more depressed about England as the game went on. Have a look at sentiment over time and compare the pre-game level with the decline over the next two hours.
We were happy to make half time and greeted the second half with a big COME ON ENGLAND! Then went back to getting steadily more depressed again.
Cole's been harshly treated for that penalty miss. He scores a low rating due to the large volume of negatives as England exit on penalties
Nobody tweets about poor old Lescott! That probably means as a centre back that you're getting the job done. I thought he had a good game.
If you want to see some methodology, it's the same as I did for England vs. Sweden.
If you follow me on Twitter (why would you not? Don't answer that) you'll know I've been playing with R a lot recently. First attempts at pulling data from Twitter resulted in a word cloud I quite liked, but which an ex-colleague dubbed the "mullet of the internet". Thanks Mark. This time, I've pointed R at Euro 2012. Specifically, I set R running from half an hour before kick off in the Group D England vs. Sweden game - 19.30 last Friday - with instructions to pull every tweet it could that contained the word "England". The results? 78,045 England related tweets (excluding re-tweets), running from 19.30 to 21.15.
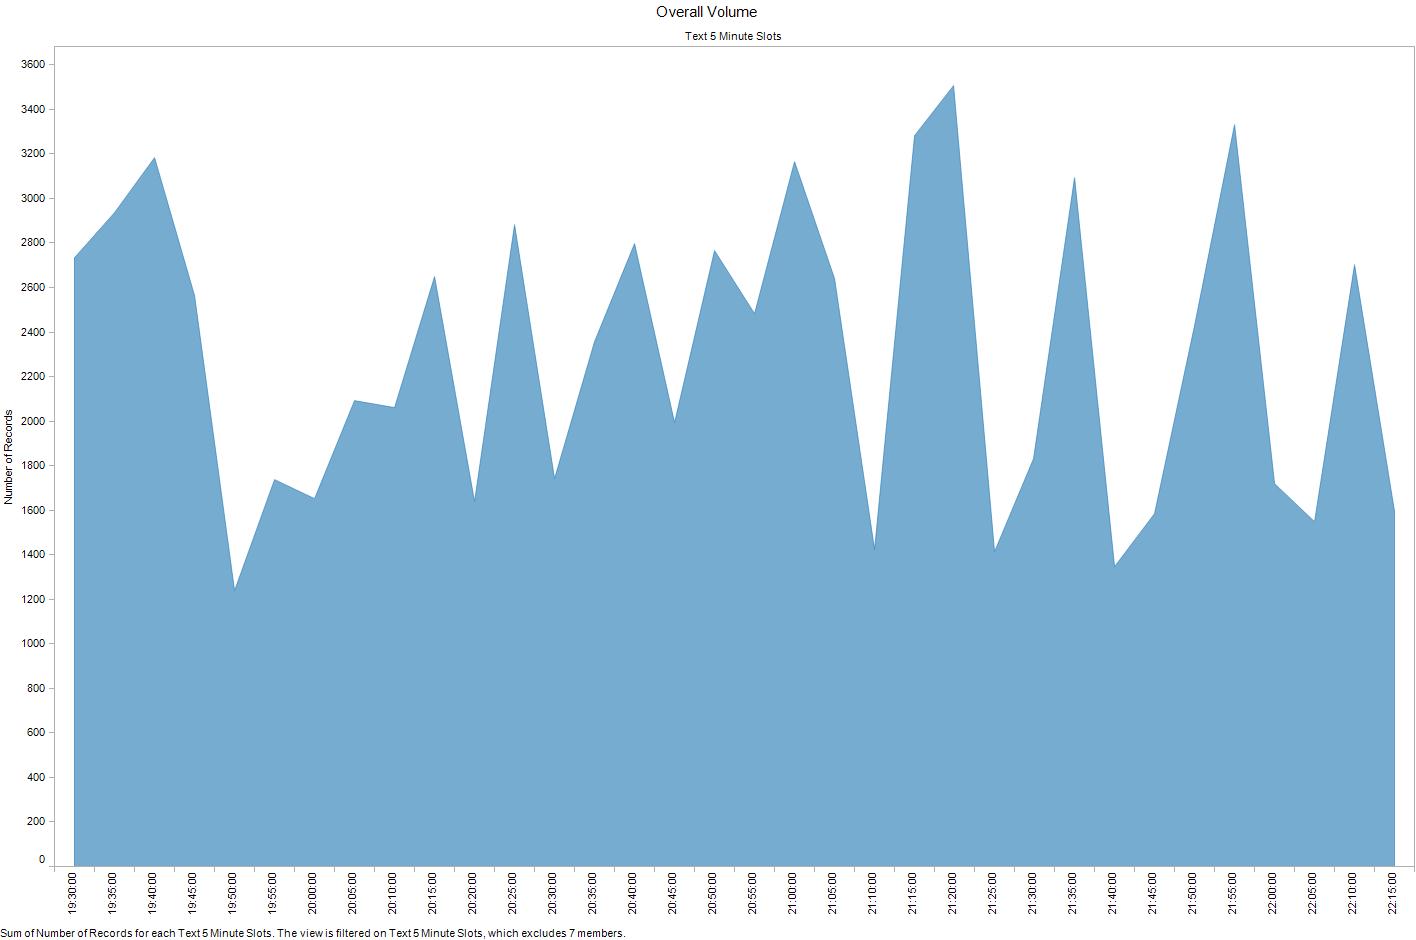
Let's see what we got. Grouping up the tweets into 5 minute intervals, here's overall volume.
We're averaging just under 2,300 tweets every 5 minutes. That's got to be enough to do something interesting with!
It's a bit easier to read if you colour the first and second half in red, with pre and post game and half time in grey.
OK, so lots of Tweets then. One of the cool things we can do with them is to split the tweets by sentiment; positive, negative or neutral. An example of a strong positive from the database would be:
"Well done and very proud of you. England may not have the most talented players but they played with guts, passion and heart #England" @ozzy_kopite
And negative (no points for grammar here either):
"Now lets watch england lose bcoz they use caroll!!! N the game will b bored!!! #damn" @Anomoshie
The sentiment algorithm isn't perfect so we're not going to push it too hard. I'm dumping any data about the strength of sentiment, tweets are either positive, negative or neutral and that's it.
If you'd like to know what kit I used to do all of this, please see the bottom of the post. I'm assuming most readers just want to jump to results, so here we go. Keep the five minute time-slots and divide the number of positive tweets by the number of negative, to get a view on how cheerful Twitter was feeling about England during the game.
On average, there are 2.8 times as many positive tweets as negative. That will partly be down to the settings on the sentiment algorithm though and it's the movements we're really interested in. Twitter was very positive in the lead up to kick off, but that didn't last long. Twenty minutes in, the balance of positive over negative had dropped from 4.1 to 2.2 as Sweden failed to roll over and let England hammer them. Then Carroll scored the opener... In the second half, we can see a trough all the way down to 2.0 as Sweden take the lead and then a positive swing via England goals from Walcott and Welbeck. The game ends on a positive / negative sentiment value of 2.9. Well played lads.
Come to think of it, well played which lads? We've got loads of mentions of the players in this database too, so let's see who Twitter thinks had a good game.
Height of the bars is positive / negative sentiment and width is volume of tweets (some players like Lescott generate really low volumes so don't take their rating too seriously.) I've restricted the database just to tweets that took place during the first or second half. If you were slating Carroll before the game, we're not interested in your opinion here!
Carroll comes out man of the match, both in terms of sentiment and volume of tweets. There's a definite break between the players who did best - Carroll, Welbeck, Gerrard, Hart and Walcott - and everyone else. The overall England rating never goes negative (below 1,) and none of the players' ratings do either, although Johnson tries hardest, which may be a reflection of his own-goal.
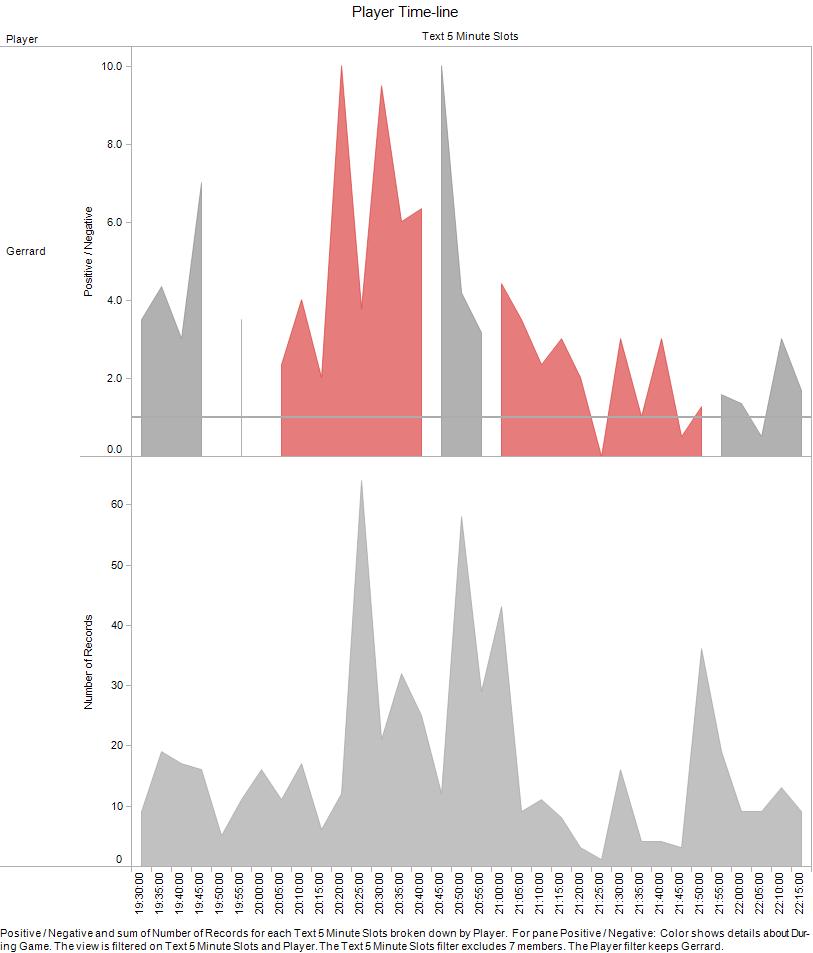
Finally, let's see how the player ratings fluctuated during the game. Sentiment on top. Volume of tweets below. This doesn't work so well for players with low numbers of mentions in tweets but you can see it works for Andy Carroll. That huge volume spike is his goal.
One more; here's Gerrard. Game of two halves for the Liverpool midfielder and his rating dropped significantly after half time.
Want to see another player? Here they are - knock yourself out. If you select "False" it will show totals for tweets that either don't mention a player, or mention more than one. The chart is a bit squashed below to fit in with the Wallpapering Fog template. For bigger, go here.
Tweet database pulled using R, R Studio and TwitteR. Sentiment analysis using the R 'Sentiment' plugin. Cleaned up a little in Excel and then all the charts are Tableau.