Showing posts with label Analysis. Show all posts

Tuesday, 2 June 2015

We need to talk about Excel

I'm not sure when it happened. I've got a feeling that the writing's been on the wall since the introduction of the 'Ribbon' menu.

I was the guy who could make Excel dance... Shortcuts flying, interactive dashboards, external data connections and VBA. I loved Excel.

A colleague, observing me building a spreadsheet a few years ago, said, "F*ck me, it's like watching Minority Report".

Proud moment.

Not any more.

Modern Excel is a mess.


It's worth taking a moment to consider how we got here. Excel was first released as Windows software with version 2.0 in 1987. It's nearly thirty years old.

Back when I started out as an analyst in 2000 - who was genuinely excited that a company had seen fit to employ him and to allocate him a desk and a PC - we were using Excel 97. This was the first version to contain proper VBA and also came with Clippy, the universally reviled Office assistant.

Clippy aside, Excel 97 was pretty good. It had most of the useful functions and features that you'd find in modern Excel and it worked.

Crucially, Excel was what you got. It was restricted to 65k rows and its charts looked bloody awful, but there wasn't really an alternative.

Having VBA baked-in made Excel tremendously flexible (and the bane of IT departments everywhere). With a bit of creativity, you could use it for statistical modelling, interactive dashboards, as a calendar, a project planner, a to-do list... And we did. Excel got (ab)used as a solution to every business problem going.


Back in 2000, Excel was the centre of an analyst's world. What happened?


Specialist software has chipped away at Excel's 'jack of all trades' USP.

If a computer can do it, you can probably make Excel do it. That's no exaggeration. VBA is behind Excel and so if some functionality doesn't exist out of the box, then you can add it. You want games in Excel? Here are fifty. Be warned: I make no guarantee those games won't royally screw up your PC. VBA can do that too.

When you break down the uses for Excel, you find new competitors are encroaching on all sides. Competitors that are designed to do a specialist job, to do it really well and that integrate with each other to provide a complete solution. For statistical modelling, you've got R, SciPy, Matlab... For visualisation, you've got R (again), Tableau, Qlik View... For data storage you've got a vast array of options and for data processing (ETL), you've got Alteryx, Pentaho and again, the list goes on.

That's just the things that Excel is actually for. Under the list of things that Excel has been abused to make it do, there are hundreds of better options. Many of them free. If you want a to-do list, for goodness sake pick something that's designed to do that job.


Excel is like a Leatherman multi-tool. You can get most DIY jobs done with it if you try hard enough.


But a Leatherman is rarely the best way to do any specific job. You want a proper screwdriver, or a full-size hacksaw, or to have a corkscrew for your dinner party that's not also attached to a pair of pliers.

A specialist's toolkit looks like this. One tool - the right tool - for each job.


This is Excel's problem in 2015. It's trying to do everything - often by bolting on more plugin tools - and so it's doing almost everything badly.

Excel's a great way to make some very average looking data visualisations, or to store your data in a way that makes it really difficult to manipulate quickly and to refresh. Excel can deliver a crap interactive dashboard to a (SharePoint) web page and it can do statistical modelling that's really hard to repeat, and leaves no audit trail.

Yes, you can sort of fix those issues, with plugins and macros and hacking and creative thinking, but that's back to fixing your motorbike with a Leatherman, when you could have had the full range of Snap-On tools.


Modern Excel has one more problem. And it's a biggie...


You can't be a beginner's introduction and a specialist's cutting-edge tool at the same time

Yes, I'm going to start with a rant about the Ribbon menu. It was a stupid idea when it was introduced and it's still a stupid idea now. When you watch an experienced user manipulate a familiar piece of software, you'll rarely see them touch the mouse, because it's a slow way to do what you want.

Microsoft introduced the ribbon to make features more prominent for selection with the mouse (and presumably with a view to the arrival of touch-screens). With subsequent releases, more and more features have moved into areas where they are difficult or impossible to access with the keyboard; try formatting a chart, or even saving a file in Excel 2013.

This might sound like a petty complaint, but it's a symptom of a very serious issue. The Ribbon and mouse / touch control were a big two-fingers to experienced Excel users.

Excel has been progressively dumbed-down to make it easier to access for inexperienced users.

Which is absolutely fine.

Except that simultaneously, Microsoft has introduced PowerBI, with features that aim squarely at advanced data manipulation and visualisation. I've tried them and to be frank, they're not up to scratch. They're awkward to install, difficult to use and when you do get them to work, they produce very average looking output.

Excel has ended up in a place where it's too advanced and has too many features for novice users and it's not as good as a dedicated toolkit for specialists. That's not a comfortable place to be.


Where now?

Excel has a strong defensive position, in that big IT departments like it because it's part of a suite of Microsoft software that they're already buying. As a business analyst, you also need Excel plus other tools - if only because everyone else still uses it - so it's not going anywhere in a hurry.

That defensive position is being eroded on all sides though. Particularly because you can get a lot of the competitors that I've been discussing for free. If your corporate IT environment isn't completely locked down, then you can make a lot of headway with open source, start to get your best work out into the world and then argue about commercial software licences later...

There is also one thing that Excel is truly brilliant at and it's not to be dismissed lightly. Sometimes you want a multi-tool. Just for a quick job, because it's easier than delving into the big toolbox. Excel is a fabulous tool for this. For quickly reformatting one-off data, for banging out a functional chart, or for correlating a couple of variables, you can't beat Excel.

Microsoft should recognise this use for Excel and take it right back to basics. Turn it into a Leatherman; a lightweight, portable, do-anything, data scratch-pad, that's not trying to be more.

They'll still need a full featured BI solution of course, and possibly something else that targets less experienced users, but stop trying to make Excel the scaffold that holds the whole data analysis structure together. It's not working and if my experience is anything to go by, it's leading experienced users to actively dislike the product.

If Microsoft don't produce that lightweight scratch-pad for data, I firmly believe that somebody else will and that could spell the end of Excel as a tool for serious analysts. Excel will have been replaced for the one task at which it is still the best option.

Wednesday, 11 March 2015

My data analysis toolkit

Growing out of posts like "Losing touch... Or why Excel and VBA won't cut it any more" and "How to do football analysis in Tableau", I've been asked a steady trickle of questions this year about what analytical software I use.

One of the biggest discoveries I've made as I branched out from Excel and VBA is that there isn't a right answer to what software you should use. There are loads of programming languages, loads of dashboard solutions, loads of databases and you can't possibly get experienced with all of them.

It's better to find yourself a set of tools that work and to know those tools well, than to have bits of knowledge all over the place, but not be using any of your kit to its full potential. If your data size isn't measured in terabytes, then you don't need to be right on the bleeding edge.


For outside of work projects, I've got a couple of machines that aren't anything fancy. An older Core i5 laptop with 4GB ram and a Core i7 laptop with 16GB ram. A regular laptop like that, costing between £500 and £1000 is more than enough for chucking around datasets up to tens of millions of rows and analysing them.

On to the software... As I said, there isn't a right answer to what you should use, but I hope this post might be useful to a few people as a starting point. If you've broken Excel and if Access has you tearing your hair out then read on. Opening Microsoft Access at all, is a very strong signal that you need to get acquainted with some of the tools on this list.

And as an added bonus, almost everything I'm going to talk about is free!


Question: Can I get by without Microsoft Windows?

Answer: Yes! You need Linux Mint.


Mint is a very Windows-like desktop environment and since the Windows 8 (Metro) car crash, it's arguably more Windows-like than Windows is.

Easy to install and easy to use, I wrote a short intro to Mint, a couple of years ago.

Be warned, that if you use Linux for anything more than a bit of web browsing, you are going to end up using the command prompt and Googling to fix broken things. But then you'll be doing that with the DOS prompt in Windows too, because a lot of data analysis software is designed around Linux and needs persuading to work properly with Windows.

If you've got an older machine lying about, stick Mint on it. You might be surprised at how good it is.


Question: Which database?

Answer: MySQL Community edition

Yes, there are newer, fancier Big Data technologies out there and I'll learn them at some point, but I want the SQL language I know, in a fast, familiar, free package and MySQL does that.

On Linux, you might have to do a bit of reading to get it to work properly (watch that you need to install the Server and Client packages), but it powers half the internet - including Twitter - and isn't too hard if you're patient and don't mind Googling an error message or two.

On Windows, make sure you download the MySQL Installer. Don't try to work out what packages you want and install them individually. You will inevitably bugger it up.

Once you've installed MySQL, if you're using it for data analysis rather than to power a small website, you MUST customise my.ini (Windows) or my.cnf (Linux), or it will run like treacle. Out of the box, MySQL is designed to run on really low-powered hardware and its memory usage settings are turned way down. Have a Google.

To go with your MySQL Server, you'll want MySQL Workbench, which you can use to write queries and maintain your database. It's packaged up in the Windows Installer that I mentioned, or you can install it separately on Linux.

Don't know any SQL? You should. Start here.


Question: Which programming language?

Answer: I use Python and I like it a lot.

If you're making the switch from VBA Macros, or taking your first steps in programming, then Python's a powerful, approachable place to start.

On Windows, I'd recommend installing ActiveState's Python package, because it handles all the set up for for you and prevents you from getting into a situation where you're pretty sure you installed Python but it just doesn't work.

On Linux, you already have Python installed and you just need a nice piece of editing software to write your code in.

On Windows and Linux, for writing code I've recently adopted PyCharm following a recommendation from @penaltyblog and it's the most straightforward editor I've seen that still has all the features you'll want as you progress.

It might feel a bit weird coming from Excel Macros that the editor you use to write code and the programming language itself are separate things, but that's Open Source for you - it gives you choices. MySQL is the same; you don't have to use MySQL Workbench to talk to your database if you don't want to and there are loads of other choices, but Workbench is an option that works and that's what this list is all about.

No idea how to use Python? Start here.


Question: What do you use for statistical analysis?

Answer: I use R.


R is free and tremendously powerful. It's a proper, highly capable programming language for working with data and the output you can produce using it is amazing.

Unfortunately, it's also got a learning curve that's close to vertical. Your first steps after working through tutorial examples, will not be easy. I'm definitely not an expert, but I'm improving...

The first step with R is to install R Studio, which makes life much easier. Don't try to install and use R without R Studio - it's unnecessarily painful.

The second step is to have a look at a beginners tutorial.

And when you get stuck, have a look on Stack Overflow. R errors can be really awkward things to Google, partly because it's just a single letter and partly because its user forums are horrible. Stack Overflow and R Bloggers will already have answers to most problems you'll hit and if they don't, you've probably got the wrong end of the stick and are asking the wrong question.

Ask a question on Stack Overflow at your own risk. Chances are somebody else has asked the question before and you could have found it by searching. The bar on what is a good question asked in the right way, is also set quite high!

As an aside, if you don't know R or Python, then they are interchangeable for a lot of work, such as web scraping. R is a statistics package with a lot of general programming capability and Python is a programming language with some really good statistics packages. You could try to stick with just one of them.


Question: And for graphs and data visualisation?

Answer: Tableau Public. And R again.

For a basic grounding in Tableau, try my  "How to do football analysis in Tableau" guide. Tableau's a fabulous piece of software and a brilliant way to get interactive charts and tables onto the web. It's also my first stop for visually interrogating a new dataset and seeing what it contains.

Tableau Public - which is free - is limited vs. Professional in that you can't load more than a million rows of data at a time and you can only connect to spreadsheets, text files and Microsoft Access. It's well worth working around those limitations though, to get access to the powerful tools that Tableau offers.

When I want a visualisation that's more bespoke than Tableau offers, I turn to R packages, because that's what I know. There are a whole host of other amazing technologies out there for bespoke data visualisation, like D3 and Processing, but it's very much a case of picking your battles and learning what will be most useful to you. I'm not a graphic designer and so am sticking with R and Tableau for now.


Question: Is there still a place for Excel?

Answer: Absolutely, there is.

Excel's still a very useful tool, even if only because you know exactly how it works, so you can use it to solve problems quickly. It's also very handy that almost everybody else has got a copy so you can share spreadsheets easily.

More and more though, I'm seeing Excel as a scratchpad for hacking data around before I put it somewhere more permanent. You can see what you're doing with Excel and for small to medium sized datasets, it works really well, provided what you're building is a one-off view of data that doesn't need to be updated.

Actually, I wish Microsoft would recognise this use for Excel, strip out all the crap and cut it right down. Just a blazingly fast spreadsheet, with worksheet formulas, pivot tables and simple charting. Nothing else. It'll never happen though.

As soon as your work starts to morph into repeatable analytics, or proper dashboarding, get it out of Excel. We used to use Excel for everything because it was all we had. That's not true any more.

The free alternative to Excel is Libre Office Calc and it's just about okay. If you haven't got Excel, it's worth installing but you'll end up in MySQL, R and Tableau earlier, because Calc is a lot less capable when you throw a sizeable amount of data at it.


Question: Any other bits and pieces?

Answer: One or two...

Notepad++ is a must for text editing and definitely put the Poor Man's T-SQL formatter plugin on it, so that you can clean up your SQL queries. You don't realise Wordpad is rubbish until you try something else that works properly.

Pentaho Kettle is cool and worth a look if you want drag and drop ETL (extract, transform, load) for your data. I got very excited about Kettle a while ago and I still use it quite a bit, but you may find that R steps up to do the same jobs as you get better at it.

Gephi is what I used to draw my analyst network visualisation. It's a piece of software focussed on networks rather than general purpose analysis, but a lot of fun to play with.

And finally, Digital Ocean is an awesome web service, where you can spin up a virtual Linux PC (they call it a Droplet) for $5 a month. When I want to run a web scraping Python script without the risk that my laptop will reboot half way through, I stick it on Digital Ocean. You can also put a 20GB MySQL server in the cloud this way and access it from anywhere. It won't be super fast for the basic $5 a month, but it's very handy if you access data from a few different places. If you use this link to sign up, you'll get $10 free credit and I'll get a bonus too. Everybody wins!


I hope that this post might set one or two people off trying new tools. As I said at the beginning, this isn't claiming to be the right answer to what you should use, or even the best answer, but it's a tool kit that's working for me and took quite a bit of sifting through different options to arrive at.

If you disagree with any of the choices, do hit the comments section. I'm always looking for better options, but only if learning them will save time in the long run...

Thursday, 5 December 2013

What analysis is good at

It should be an easy question to answer. It should be, but it's not.

What is statistical analysis consistently good at?

I'm talking here about it's real use to the Managing Director of a company, or to the Chairman of a professional sports team, or to a politician. To somebody who has choices to make and is looking for help to make the best choice that they can.

A sceptic can easily reel off a list of things that your analysis can't do. Your analysis probably can't account for human frailty, or random chance, or a whole host of things that it was never designed to measure in the first place.

Your analysis can't forecast the effect of something that's never been tried before.

Your analysis says 'trust my numbers', but offers no guarantees of success.

And your numbers can't spontaneously volunteer new ideas; only tune up the effectiveness of old ones.

When you come right down to it, complex statistical analysis is a waste of time and effort, right?

As an analyst, I hear some of these arguments a lot. It's true that statistical analysis can't come up with the perfect strategy on its own, but it's still a hugely important tool. Here's what I think statistical analysis is really good at.


Analytics will conclusively reject a multitude of bad strategies that you might otherwise employ.

Analytics stops you making avoidable bad decisions.


Does that sound a overly negative? It doesn't have to be.

This is the scientific method applied to business and its tremendously powerful. Scientists know that you can't ultimately prove the truth of anything; that there's always the possibility that you're wrong. What you can do is falsify what definitely isn't true. All of our scientific knowledge about the world is based on theories that we're only working with for now, until we prove that they're wrong. All of it. But just look at the progress we've made by rejecting ideas that don't work...

It's this scientific method that means we've found ways to cure many diseases, which were previously terminal. And it's the rejection of this evidence-based method that can kill people who believe strongly in homeopathy.

Do you reject analytics because the answers are obvious and it will just tell you what you already know? You're a corporate homeopath.

Rejecting ideas that don't work is real progress and a truly valuable exercise. It's how we learn; we try something, we reject it, we have a think and then we try something else until we find a method that works.

You can often spot a good analyst by the way that they approach problem solving. If you ask a good analyst why sales are declining, they'll come up with a whole host of different possibilities and then work with data to disprove them - one at a time - until they're left with the most plausible explanation. It's a process and it's the true value of analysis. It stops us from accepting hypotheses that aren't true; from blaming bad weather, or bad luck for under-performance, when really our business has systematic problems.

Sam Allardyce (the West Ham manager) talked this week about using statistical analysis in football and it's fantastic to see this type of discussion starting to gain real traction. Something that he said struck me as slightly jarring though.


"You can take out of it what you want. You can find your best performance in each area. You can find your best performance on fitness level, you can find your best performance in possession…"


It might just be throwaway phrasing from the interview, but that could also be heading firmly in the direction of confirmation bias. If you analyse your best performances, you'll find the occasions when what you tried appeared to work. Your worst performances are often a lot more valuable, because you're forced down a route of working out why they were bad and then coming up with ideas to fix them.

Very often, I find that analytics sceptics are those who are looking to confirm the effectiveness of the strategy that they're already employing. It's self-fulfilling then, that your analysis won't be able to teach you anything new. At best, analysis like this is an internal marketing tool; a way to 'prove' you're right and end any debate about other options and in the short term - until everybody works out that's what you're doing - it might be somewhat effective at that job. EMI was determinedly doing using analytics like that for the short time I was employed there. Before reality struck and it was broken up and sold.


Good analytics...

Proves conclusively that bad ideas aren't working

And so forces you to think up new ideas

Which you can then analyse to see if they're an improvement


Good analytics...

Gets you there faster. Of course you'll work out eventually that a bad idea isn't working, but wouldn't you rather know now, before it's too late?

And finally, good analytics will prompt new ideas, by giving you details about what went wrong with the old ones.


There are so many other benefits of taking an analytical approach to a problem, but this is the big one. This is what statistical analysis is really good at and this is my answer when faced with scepticism. Of course analytics can't solve every problem, but used correctly, it can solve a very, very big one.

Thursday, 21 March 2013

Eight steps to building analytics that actually get used

Inspired by a couple of football related posts around the topic of "what is analytics?" I've penned a few thoughts on a slightly different subject. Once you've decided what analytics is, how do you build something that will actually get used? It's often easier said than done... Many big ideas ultimately fail to deliver and I'm convinced there are just as many brilliant insights out there, which nobody's paying any attention to.

I'm writing mostly from my experience in the marketing analytics world, but these would guide my approach pretty much anywhere. How do you build a piece of analytical work that ends up delivering something valuable, rather than sitting on a hard drive, gathering virtual dust?


Clearly identify your questions first


This is a useful process in itself. What, specifically, do you want to know?

Now make it even more specific; break your question into pieces. And then possibly more pieces.

What would the world look like if the answer to this individual piece was "Yes"?

Now you can start doing analysis.


Walk before you run

If you try to go from nowhere, to the answer to life the universe and everything in one step then you're almost certain to fail. If only because right now, what you think the ultimate answer should look like is very likely to be wrong and you need to let some groundwork shape your next steps.

Before you collect any new data, what could a good analyst achieve with the data that you have? By the way, if you ask and they say "nothing" then they're not a very good analyst. A good analyst isn't afraid to speculate based on limited data, but they should also be honest and tell you that's what they're doing.


Have an opinion

You've just done a month's statistical modelling work and you can't present it back as an academic might, by saying "the effect of X is probably Y and the effect of Y is probably Z." We analysts like to hedge our bets, but if you want your stuff to get used, you can't do that. You're going to have to put your neck on the line.

You have to have an opinion. As a result of your work, what should be done? State it and state why you believe it, then allow people to disagree based on the evidence.


You need management backup

You know why Moneyball worked? Apart from all the clever numbers, Billy Beane, the A's General Manager believed in analytics, put it front and centre of decision making and didn't seem to mind who he upset along the way.

An angry analyst stamping their foot and demanding to be listened to, won't cut it. If you're trying to change an organisation, you need very senior backup and they need to trust their analysts.

Be careful what you wish for. Getting this bit right means that as an analyst you're going to feel some real pressure.


That management backup needs to have an open mind

Building on the previous point, it's no good having an evangelist forcing analytics into a company's decision making, if they're just using numbers as a battering ram, to push the strategy that they had anyway. We're back to trust again, to be earned by analysts and then respected by senior management.


Plain English Answers

As Albert Einstein said, "If you can't explain it to a six year old, you don't understand it yourself."

Dump the jargon and the statistics and find a plain English way to explain your results. Stories are good.


Never talk to IT until you've got a working prototype

I can't stress this enough. The only way to brief an IT development team to build you an analytics product, is to say, "See this? It works. Please turn it into a robust product for me."

Any IT people reading, the comment section is below - feel free to let me have both barrels, but this is true for virtually every IT team I've ever come across. IT and analytics are often confused, because they share some skills, but at the beginning, you need to be sure you're talking to analysts, not programmers.


Analysis is a process

Treating pieces of analysis as individual questions that are paid for individually, answered and then put to rest is very rarely the best way to get results. Analyses answer some questions and raise some more. They guide decisions, but could always be built better the second time around. Sometimes, despite everyone's best efforts, a line of enquiry doesn't achieve all that much.

Treat starting a piece of analysis as starting a process of discovery, rather than paying for the answer to a specific question right now, and over a period of time you'll reap the benefits.


Have I missed anything? What's the key reason why a piece of analysis you've done is still in use, or what barrier killed a piece of work that should have been brilliant? I'd love to hear about it in the comments.

Tuesday, 17 July 2012

Ten rules of marketing analysis

It's been a while since we had a top ten on Wallpapering Fog. Number one on this list came up (again) today, so let's have Wallpapering Fog's top ten rules of marketing analysis.
  1. If you think you've discovered a radical, unexpected, new result that nobody's ever noticed before, your data is wrong.

  2. More complicated analysis can help you measure your marketing much more accurately. But if simple analysis can't find any impact at all from a marketing campaign, then there probably wasn't one.

  3. Nobody ever abandons a campaign that doesn't work, the first time that you prove it doesn't work. Three is the magic number.

  4. ROI means return on investment and it's measured in money. Not clicks, likes, web traffic or re-tweets.

  5. If you're not selling ice-cream, then the weather isn't responsible for your 50% year on year sales decline. Even Noah needed food and clothes.

  6. Never trust a piece of research that was funded by a media owner.

  7. Ten thousand respondents is plenty. A million is very rarely necessary - it just takes much longer to open the spreadsheet. You only need a spoonful of soup to know what the whole bowl tastes like.

  8. That means the BARB TV ratings panel is fine. Leave it alone, online people.

  9. When forecasting next year's sales, assume that your new adverts aren't any better than your old adverts. I'm sorry if that's depressing, but it's almost always true.

  10. The world is never changing so fast that you can't learn something from the past couple of years. People's basic motivations haven't changed since the dark ages.

Monday, 25 June 2012

Joe Hart officially named Twitter's man of the match.

England vs. Italy, 24th June 2012...

88,142 tweets mentioning "England"...

Analysed for positive or negative sentiment and then used to rate each player's performance.

The result? Joe Hart was England's man of the match based on tweets that mentioned player names. Ashley Young was, erm, less good.

Instead of the usual static infographic, here's a Tableau dashboard! Don't forget to click on the different pages across the top. Go here for overall England ratings, player scores and interactive player performance over time.


A few interesting bits that popped out for me...
  • Rooney's performance was nowhere near his pre-match expectation (check his time-line)

  • We all got progressively more depressed about England as the game went on. Have a look at sentiment over time and compare the pre-game level with the decline over the next two hours.

  • We were happy to make half time and greeted the second half with a big COME ON ENGLAND! Then went back to getting steadily more depressed again.

  • Cole's been harshly treated for that penalty miss. He scores a low rating due to the large volume of negatives as England exit on penalties

  • Nobody tweets about poor old Lescott! That probably means as a centre back that you're getting the job done. I thought he had a good game.

If you want to see some methodology, it's the same as I did for England vs. Sweden.

Monday, 18 June 2012

Rating England vs. Sweden using Twitter

If you follow me on Twitter (why would you not? Don't answer that) you'll know I've been playing with R a lot recently. First attempts at pulling data from Twitter resulted in a word cloud I quite liked, but which an ex-colleague dubbed the "mullet of the internet". Thanks Mark.

This time, I've pointed R at Euro 2012. Specifically, I set R running from half an hour before kick off in the Group D England vs. Sweden game - 19.30 last Friday - with instructions to pull every tweet it could that contained the word "England".

The results? 78,045 England related tweets (excluding re-tweets), running from 19.30 to 21.15.

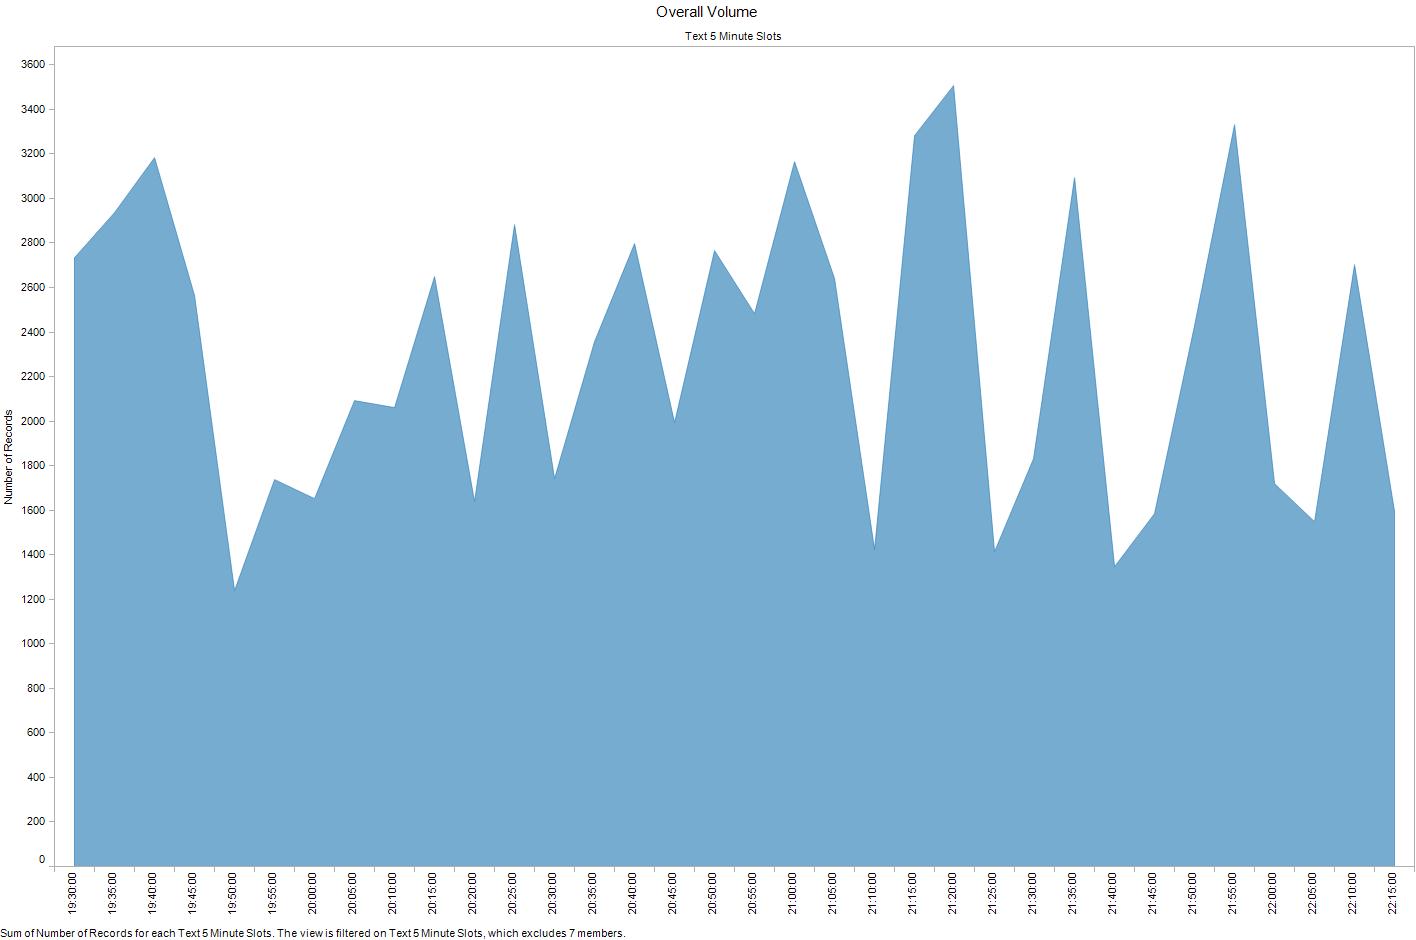
Let's see what we got. Grouping up the tweets into 5 minute intervals, here's overall volume.


We're averaging just under 2,300 tweets every 5 minutes. That's got to be enough to do something interesting with!

It's a bit easier to read if you colour the first and second half in red, with pre and post game and half time in grey.


OK, so lots of Tweets then. One of the cool things we can do with them is to split the tweets by sentiment; positive, negative or neutral. An example of a strong positive from the database would be:

"Well done and very proud of you. England may not have the most talented players but they played with guts, passion and heart #England" @ozzy_kopite

And negative (no points for grammar here either):

"Now lets watch england lose bcoz they use caroll!!! N the game will b bored!!! #damn" @Anomoshie

The sentiment algorithm isn't perfect so we're not going to push it too hard. I'm dumping any data about the strength of sentiment, tweets are either positive, negative or neutral and that's it.

If you'd like to know what kit I used to do all of this, please see the bottom of the post. I'm assuming most readers just want to jump to results, so here we go.

Keep the five minute time-slots and divide the number of positive tweets by the number of negative, to get a view on how cheerful Twitter was feeling about England during the game.


On average, there are 2.8 times as many positive tweets as negative. That will partly be down to the settings on the sentiment algorithm though and it's the movements we're really interested in.

Twitter was very positive in the lead up to kick off, but that didn't last long. Twenty minutes in, the balance of positive over negative had dropped from 4.1 to 2.2 as Sweden failed to roll over and let England hammer them. Then Carroll scored the opener...

In the second half, we can see a trough all the way down to 2.0 as Sweden take the lead and then a positive swing via England goals from Walcott and Welbeck. The game ends on a positive / negative sentiment value of 2.9. Well played lads.

Come to think of it, well played which lads? We've got loads of mentions of the players in this database too, so let's see who Twitter thinks had a good game.

Height of the bars is positive / negative sentiment and width is volume of tweets (some players like Lescott generate really low volumes so don't take their rating too seriously.) I've restricted the database just to tweets that took place  during the first or second half. If you were slating Carroll before the game, we're not interested in your opinion here!


Carroll comes out man of the match, both in terms of sentiment and volume of tweets. There's a definite break between the players who did best - Carroll, Welbeck, Gerrard, Hart and Walcott - and everyone else. The overall England rating never goes negative (below 1,) and none of the players' ratings do either, although Johnson tries hardest, which may be a reflection of his own-goal.

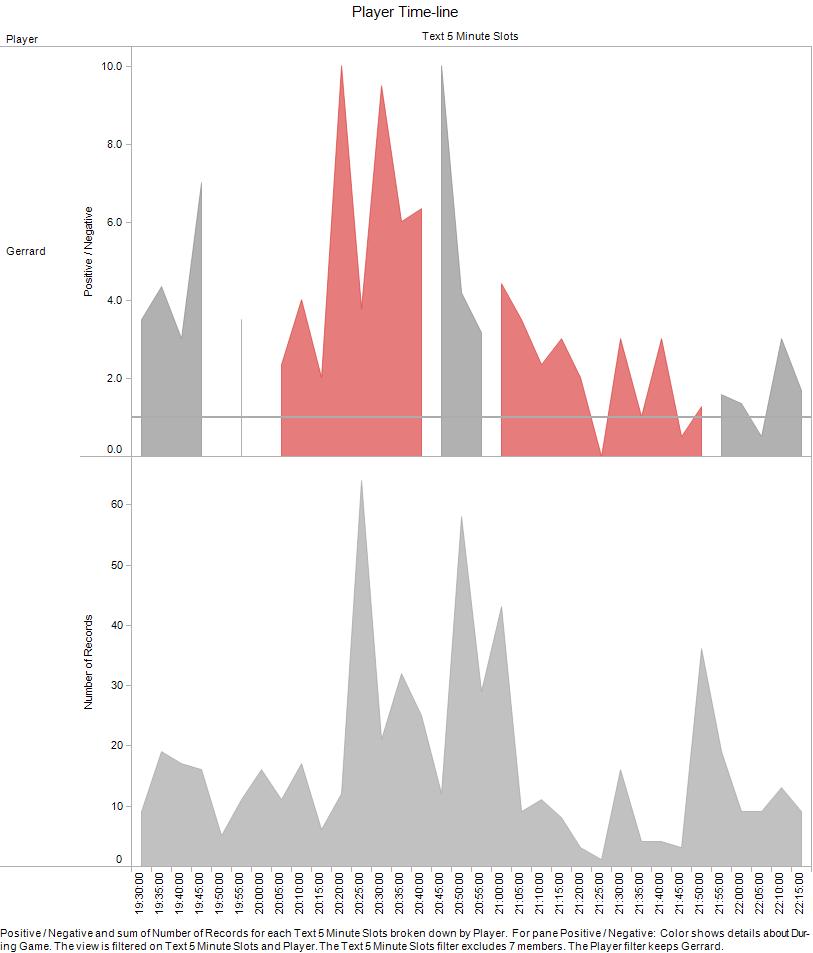
Finally, let's see how the player ratings fluctuated during the game. Sentiment on top. Volume of tweets below. This doesn't work so well for players with low numbers of mentions in tweets but you can see it works for Andy Carroll. That huge volume spike is his goal.


One more; here's Gerrard. Game of two halves for the Liverpool midfielder and his rating dropped significantly after half time.


Want to see another player? Here they are - knock yourself out. If you select "False" it will show totals for tweets that either don't mention a player, or mention more than one. The chart is a bit squashed below to fit in with the Wallpapering Fog template. For bigger, go here.


Tools:

Tweet database pulled using R, R Studio and TwitteR. Sentiment analysis using the R 'Sentiment' plugin. Cleaned up a little in Excel and then all the charts are Tableau.

Monday, 26 March 2012

It's never been about the data

A lot of people are getting very excited about data again. Journalists particularly, seem to think they've spotted a new source of stories and are jumping on the 'Data Journalism' bandwagon.

The latest article to drop onto my Twitter feed - and the one that's prompted this post - is 'Data is the new black', accompanied by the now obligatory infographic that's not an infographic.

This latest surge of interest in (Big) Data is slightly different to the ones we've seen before. In the past, we've heard huge promises for what data analysis could deliver and then very often, nothing at all was delivered. To pick one example from the marketing world, 'Project Apollo' was rather expensive and never really made much progress. Data analysis projects often bogged down in the data assembly phase (they still do), without managers ever seeing much beyond PowerPoint decks that prophesied the arrival of data nirvana. Data nirvana being permanently around six months away, once we've sorted out a few teething problems. And could we have £40k for another database analyst to fix those teething problems please.

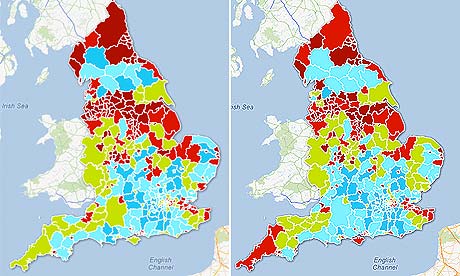
This time around, data is delivering some output. Recently, The Guardian had a very pretty interactive illustration of poverty rankings across UK regions, that would have been hard for a newspaper to put together even a couple of years ago. Tools like Google Fusion Tables and Tableau are making that data assembly phase more accessible and quicker to throw output at an audience. It looks like we might be getting somewhere.


The Guardian's work is showing exactly where we're getting though and it's not quite the brave new world that some have promised. When you complete a major piece of analysis, you very often prove the answer that you were expecting in the first place. This isn't just true of social science, it works for classical scientific research too.

Think about what a scientist does, away from the media spotlight of a genuine breakthrough:
Is this a cure for the common cold? No. Is this? No. What about this? No. This one? Still no. It's not that we should stop looking but you can be 99% sure what the answer's going to be before you start.

The same happens with social science data like economic statistics and population demographics. When you examine them, largely, you prove what you already suspect. The Guardian's proved that the North of England is more deprived that the South. We knew that.

Examples of genuine revelations from marketing databases are hard to find and those that do surface are often dubious. The legendary nappies and beer example (diapers and beer if you're American) states that database analysts working for a major retailer noticed nappies and beer were often sold together. The story goes that young male parents often buy nappies on a Friday night and pick up a pack of beer at the same time, so cross marketing these two products is extremely effective. Take your pick on which retailer came up with it - Wal-mart, Tesco, ASDA - it's not actually true.

What data does let you do is to make a case more strongly. Data analysis helps us to move the foundations of a discussion from opinion, to fact, so that the discussion can move on to what we do about those facts. In marketing, if there's a widely held suspicion that a piece of advertising doesn't work, then it almost certainly doesn't, but very often it's not until you prove it, that the offending campaign will finally be pruned from the schedule.

It's never been about the data; it's about the question. Data can provide a stronger answer to a question than opinion alone and so if you ask the right questions, it will help to make a stronger argument. What it will never do is proffer insights of its own accord and it will rarely shock you in its conclusions. Those looking for epiphanies from analysis of Big Data, are likely to be disappointed.

Monday, 27 February 2012

Why VBA macros got everywhere

Last week, I wrote a post that suggested Visual Basic for Applications (VBA) could be declining in importance for today's analysts. I do think that it is and that it will continue to do so, because it's not evolving to meet the needs of bigger data, or to compete with new and better ways of building dashboards.

VBA has got a valuable lesson to teach though. Never mind that it may now be feeling the pressure from new competitors, how on earth did a BASIC programming language that was bolted to the back of Microsoft Office - and particularly Excel - get to be so important in the first place?

I touched on one of the reasons in that previous post.

"it will let you do things that are otherwise the preserve of IT, which should be the ambition of any good analyst. If you need IT to sort data out for you, then you've failed."

VBA is a fantastic tool for empowering analysts to build their own solutions to problems. It gives analysts the power to create innovative new bits of kit without learning the sort of heavyweight programming, that is the preserve of full-time coders with computer science degrees. What analysts produce in VBA - and I speak from personal experience here - is quite often horrifying to their IT departments. Even very good code by analyst standards is a world away from the way that a good programmer might chose to solve a problem. For one thing, no programmer worth the name would have started their build in VBA.

The thing is, even with that coding deficiency, VBA works. It makes an awful lot of businesses run. (And along the way, it's completely hamstrung Microsoft with Excel upgrades, because it's too embedded in too many places to change it now.)

You could see sloppy programming as a failure on VBA's part; as evidence that all these macros should have been built by IT in a proper language, with version control and a detailed specification. I disagree. I'm an analyst, not an IT person and so I think what VBA did is amazing and we should be trying to repeat it.

VBA survived and it prospered. It did that because it met a need and it's a need that large companies in particular, go out of their way to avoid happening with other bits of software. Excel was the Trojan Horse that put IT capability into the hands of people who aren't supposed to have it. As VBA starts to show its age, we're in danger of drifting towards a world where centralized IT departments control access to data and access to the tools that can work with it.


There's no Trojan horse yet for Big Data. Sure, there's free software which can work with it but as a junior analyst, it's likely to be a struggle to persuade IT that they need to unlock the admin account on your PC so that you can install R, MySQL and FileZilla (and especially that you also need some space on an SQL server.) Getting software paid for will be even harder as the prevailing attitude is still one of, "you've got Office and that's all you need." The majority of IT departments never liked VBA in the first place, because macros that they didn't build crash and cause problems that the IT department is asked to fix. Never mind that a few macros which don't crash are saving hundreds of man hours per year in the finance department.

I should say at this point that I'm not trying to give IT procurement a kicking. What I do want to do is recognise that there are smaller, incredibly useful tools, which don't need a long IT build and which we can't always specify precisely at the start. They need to evolve and they need to be developed by the people who work with data and spend time with clients. By the people whose job it is recognise opportunities for data analysis and exploit them. VBA did that. As VBA ages, what's going to do it in future?

There are three ways that this could go. One is depressing and the other two are interesting.

First, the depressing one. The age of amateur coding within large companies could be coming to a close. I don't think this is all that likely as the benefits are too great, but we might be entering a phase where IT controls access to any kind of developer tools, before the pendulum swings back the other way. What will swing the pendulum back, is larger companies realising that they're taking a pasting from smaller and more agile competitors, where analysis teams are able to run with their ideas.

As a second possibility, somebody could develop the next VBA Trojan Horse. That somebody won't be Microsoft, which is unfortunate because in Office, they've still got the capability to deliver it. Microsoft currently seem most concerned with creating tools for centralised IT to use, which is why from an end-user point of view, all of Microsoft's BI tools are crap. If the Trojan Horse comes, I think it's more likely to be from a new developer delivering a platform that doesn't need admin rights to install on an analyst's PC. That platform could well be cloud based, which is awkward where data is highly confidential, but not an insurmountable problem. In the same way as for VBA, by the time people who are inclined to centralise IT processes work out what's going on, it will be too late.

The final possibility is by far and away my favourite and I think, also the most likely. We could finally recognise the benefits of giving all sorts of teams - not just analysts - some control over the software that they choose to use to do their job. When you think about it, the way we look at software currently is awfully nannying...

"Here's a PC, it's got Office and a web browser on it. That's what you get."

"I could do a much better job with a copy of xxx"

"Write a business case that costs more in terms of your time invested than just paying for the software would have, we'll think about it and get back to you in three months. Probably with a no."

Of course you still need some central control, but there are huge benefits to a flexible approach to software. On a factory production line, you use the tools you're given, but the companies we work in aren't a production line. A better analogy would be a construction site, where you have all sorts of skilled technicians doing different jobs and where you wouldn't dream of telling the carpenter that he can't use his choice of chisel, because it's non-standard.

The CIA recently hinted that it might be heading in a more flexible direction, when it told vendors that it wants to start paying on a metered "pay as you go" basis for its software. You'd do that so that you can install many and different pieces of software and pay for the good ones that end up being used a lot. You'd do it so that you don't have to enforce the same few tools across multiple departments doing different jobs.

We don't know how many analysts the CIA has or what its budget is, because both are classified, but some old guesses put it at around $27bn. The Twin Towers and quite a bit of inflation has happened since then, so I'd say it's a fair bet that we're looking at well above $30bn. That's a lot of analysts and a lot of software. Definitely worth keeping an eye on how they choose to do procurement.

If I were a software developer, I'd be looking for Trojan Horses to sneak my product past IT. Tableau Public is a nice idea, which aims to create critical mass from outside companies by letting bloggers use the software for free. It's not quite there though... Google Docs is probably closest to the cloud idea of not requiring an install and could be the future, but it's nowhere near mature enough for use by analysts. Just a good toy for the minute.

And for me, as once again a small cog in the enormous WPP wheel, I'm hoping that marketing can move to the more flexible software model outlined by the CIA. Back to the original argument, we should recognise what VBA does so well and look for ways to make it happen again. Give staff responsibility for knowing what tools they need and let them do their job even better.

Tuesday, 15 February 2011

Probably the best strategy in the world

Neil Perkin over at Only Dead Fish has written a nice piece on new measurement techniques and predictive markets. It's an area of marketing measurement that I find fascinating, even if so far I've seen very few real world marketing applications.

Prediction markets are games where you trade shares in future events. The Hollywood Stock Exchange is a famous example, where you 'bet' on the audience that films will achieve at the box office. The idea is that people (on average, in large numbers) are quite good at guessing what other people will do and the outcome of future events. Running a survey and asking people if they plan to see an upcoming film at the cinema is - runs the theory - less accurate than asking those same people whether they think lots of other people will watch it.

In one respect, it's easy to see that the theory works. In horseracing, horses become favourites because people bet that they're going to win and very often the favourite does win. Odds on betfair are effectively the punters' averaged view of what they think is going to happen in future. Websites like Political Betting take those market odds and use them as a prediction tool for election outcomes or how long the current Prime Minister will last.


If you fancy reading a bit more and playing with some toys, then Inkling is a good place to start.

The advertising applications of prediction markets are exciting. Instead of a focus group asking people if they like a new product, you could ask a sample of respondents if they think other people will buy it. Want to know which mobile phone platform will dominate in five years? Get people to bet on it. Don't ask people if they like your creative, ask whether they think it will be popular.

In terms of their output, prediction markets have some similarities to another research technique that I'm excited about; agent-based modelling. It's a bottom-up approach to modelling where you create an artificial simulated market that contains individuals, give them some rules and then see how they behave. You might set up a simulation for a new product launch and then model how shoppers trial and adopt the product as they are exposed to advertising messages. The crucial difference to top-down modelling where you analyse past sales is that the simulated individuals in an agent-based model have an element of randomness in their decision making - they don't necessarily do the same thing every time you run the simulation.


These two new techniques are similar in that their output tries to account for randomness. You don't get a single answer and in that, they're much more like reality than a lot of the techniques we use right now. What you get are predicted likelihoods that rank possibilities of things that might happen.

Think about what that means for a minute. An analyst can predict the best strategy for launching a brand and that 70% of the time in simulations, sales exceeded the target. It's the best strategy, but even in the simulation it often doesn't work. We can tune the strategy to improve our chances, but in the end, randomness in the model means we might fail even though our strategy was a good one.

Weather forecasters often give us predictions this way - they'll say that there's only a 20-30% chance of rain, so you get annoyed when you turn up for your meeting without an umbrella and soaking wet. The forecaster didn't say it wouldn't rain though, so it's your fault really - he said it probably wouldn't rain and you chose to risk it.

I'm incredibly excited about these emerging techniques, but they need some new thinking on the analyst's and on the decision maker's side. We analysts need to work out how to apply new predictive techniques to marketing. Marketers need to recognise that they're going to get some extra information on which to base a decision and not the perfect answer.

That's actually the way that analytics should always have worked, but both sides too often like to pretend otherwise.

If you ask for randomness to be included in marketing analysis, then you're going to get answers that far more often include the word 'probably'.

Tuesday, 13 October 2009

Why we're here

Why are we here? No not the answer to life, the universe and everything, which is obviously 42, but we the analysts. We the insights people. Why are we here and what are we good for?

Or put another way, what's the best way to make use of your insights department?


Conversation over a beer last night (yes on a Monday, things are going that well...) turned to what analysts should do when faced with the question 'I need your help to prove x?' It's not even really a question and I'm firmly of the opinion that if you find yourself asking or trying to answer it, things have already gone wrong. It happens far too often.

Let's go with the Hitchhikers Guide reference for a little longer. If you haven't read the book don't worry, but honestly what are you doing here? This is the realm of Data Monkeys and we've all read it. Many more than once. For any poor, lost, normal, well adjusted people who've found themselves on Wallpapering Fog it turns out the answer to life, the universe and everything is 42.

Helpful, right? And that's the joke. 42 is only useful if you understand the question.

If you regard your analysts as a rubber stamp to provide evidence for whatever strategy is flavour of the month at the moment - if you don't get their help in shaping the question, then you're in trouble. Partly because you'll have a team of pissed off, depressed analysts and more importantly because you're missing out on a huge opportunity.

Get the analysts in early. Get them in on the strategy discussions. Yes they might roll their eyes when you say 'brand value' but you roll yours when we say 'not statistically significant' so we're even.

There's no reason why having insights people on board early should make an idea less creative, but they'll be able to point out which bits of your success criteria are going to be measurable (or suggest new ones,) they'll be able to provide some useful evidence through the discussion and they just might stop you making a fool of yourself later, in front of the client, when it comes to measuring results.

That isn't the most powerful way to use analysts though. We're still taking about insight as a service - just a way to back up what the agency is already doing. Here's a radical thought... a lot of analysts (not all, admittedly) are excellent strategists, with good ideas, who just happen to be good at maths. They're people who are useful to have on board. Sometimes they come up with ideas that aren't measurable and still think they're worth trying. Make the most of it and get the analysis team in early! You'll end with stronger ideas, where you know which bits you can prove and where the client is going to have to trust you, and you won't have an insights team who - when you tell them at the end what you need to prove - look blank, worried or angry and say 'I can't'.

Wednesday, 18 March 2009

How to brief a marketing analyst

So you want an analyst to spend some time looking at your marketing? This is all about how you get a piece of work that will do something more than confuse you for a couple of hours (which means it must be very, very clever) and then spend the rest of its life in a filing cabinet.

If you don't brief your analysts this way, then they really should ask questions until you do. They might not though - it depends how good they are. Writing a good brief maximises the chance that your 50-100 grand will be money well spent.

Here are the rules.

1. Why do you want the work done?

If the answer is 'you've heard econometrics is amazing for media ROI' then don't even think about briefing anybody yet. You'll most likely end up with a model that perfectly explains why sales have moved about for the past three years but tells you nothing about what to do next year.

Here are a few possible starters for ten:
  • Finance are trying to take your budget away, so you're hoping to prove that marketing spend makes money.
  • You don't know whether it would be better to run a TV campaign, or switch the money to Press and Radio. You need the answer.
  • You want to know which of your products are most advertising responsive so that you can reallocate your spend.
  • You're launching a new brand next year and want to know how best to do it. Which channels and budgets?
  • Finance have asked you to make a case for how big next year's budget should be and you want to make that case in terms of how much product it will sell, or awareness it will build.
  • You don't know whether to run one big burst of advertising next year, or two smaller ones.
Ask the questions in detail. The best way to answer them may not even be the econometrics project that you thought you wanted.

2. What data have you got that you know of?

This goes beyond sales and promotional plans. What segmentations have you run? Research tracking? Web metrics? Tell the analysts about all of it and let them decide what's useful. You may be surprised.

3. When is the decision deadline that this work informs?

Start from there and work backwards to get your timeline. Assume the useful interpretation of any models will not arrive until two weeks after the debrief date, when you've had the chance to digest it and ask questions.

4. How will the work inform future decisions?

Do your consultants have planning software? Optimisers? Make them demonstrate them to you. I can't stress this enough - you need to see them working. Otherwise, how do you know that you're not looking at a screenshot somebody knocked up in Excel for a piece of software that doesn't actually exist yet? Or a fancy looking piece of utter garbage?

5. Who are your project team?

You need to meet them, not just the guy who's selling the project.

6. Interim meetings.

For a twelve week project, you want:
  • A kick off meeting with the analysts
  • A data review and progress meeting around 5-6 weeks in
  • A marketing team debrief about 10 weeks in, to give you the chance to tailor the full debrief towards any new questions that have come up in the past couple of months. The models might not be quite finished for this one.
  • A full debrief at the end with everybody who's interested, so that you can show off this wonderful piece of work
7. What are your marketing goals?

What, specifically, is your marketing spend supposed to change? You're not sure? Shame on you. And your ad agency.

You're commissioning somebody to measure the effectiveness of your advertising. If you've been running brand building campaigns, then looking for an effect on awareness tracking could well be a better idea than looking for an effect on short-term sales. Model sales and you run the risk of 'proving' that your campaigns are unprofitable, because you're looking for effects in the wrong place.

8. What data has the agency got?

If the analysts are independent, then how are they going to work with your agencies to source data? Or are you going to have to do it?

Which leads to...

9. Who is responsible for data?

You need a project champion who will co-ordinate all the requests for (probably a lot of) data that you're going to get. Who's going to keep track of all this and chase it up at your end? It's much, much better to do it this way than have an external company mailing all sorts of people they've never talked to at your company and hoping to get a timely reply.

10. (This one is less about the brief, but is still incredibly important.)
Get everyone who will use the results involved at the start.


Any and every piece of modelling work can be picked apart. Always. Academics spend years doing it to each other in journal articles and they spend years building the models in the first place. We build models in a couple of months. That doesn't mean they're wrong, but it does mean somebody can definitely argue with the way the work was done and refuse to believe its results.

If you plan to use the results outside the marketing department then get those people in for the kick off meeting. It's much harder to argue with a piece of work that you agreed at the outset was a good idea...


That's it, a handy list to cut out and keep. Anything I've missed?

Monday, 26 January 2009

Jacqui Smith needs to have a word with some Clubcard analysts

The UK government seems to be easily seduced by IT companies offering all encompassing database solutions to its problems. Contactpoint goes live today, holding the details of every child under 18 in the country and designed to prevent cases of child abuse slipping through the cracks chasms between different government agencies.

The NHS computerisation scheme is four years late after five years work and will cost £12.7bn if it's ever finished. That has very little to do with marketing, but you've got to really believe in a database to pay £12.7bn for it.

The government also aims to release the Interception Modernisation Programme by 2012. This is a big one, holding details of all electronic communications between individuals. Like having a huge itemised phone bill that includes emails, texts and telephone calls. Baroness Miller asked a question in the Lords concerning,

"three billion emails - that is 35,000 every second - 18 million internet connections and 57 billion text messages a year."

Disregarding the - frankly, vast - civil liberties implications of this database, would it be useful? Marketing analysts like big databases too, so what have we learned?

When a marketing analyst analyses a huge database, they're not looking for individuals. They're looking for patterns of behaviour among groups, that might be useful for targeting adverts.

The legendary nappies and beer example (diapers and beer if you're American) states that database analysts working for a major retailer noticed nappies and beer were often sold together. The story goes that young male parents often buy nappies on a Friday night and pick up a pack of beer too, so cross marketing these two products is extremely effective. Take your pick on which retailer - Wal-mart, Tesco, ASDA - it's not actually true.

The story works because it's an example of the sorts of things that marketing database analysts might look for. More realistically, analysts would profile different customer segments so that appropriate offers can be targeted towards them. What offers might appeal to a 25 year old mother of two who buys a lot of ready meals?

When you try to pick individuals out of the database, the whole thing falls apart. As well as being useless for marketing purposes, the 'outliers' (© Malcolm Gladwell) are, well, weird.

Some analyst friends working on a customer loyalty database, used to run a routine that looked for fraudulent activity. It picked out the people who were earning unfeasibly large numbers of rewards and flagged them for investigation.
As well as a few charlatans, it found a chap who was quite legitimately routing all his utility bills through the loyalty scheme and was quite probably their perfect customer, a member of the Saudi royal family with an unfeasbily large shopping bill and a football supporters' club where all the members were earning rewards together for fundraising.

What the goverment will find out if they ever get this thing off the ground, is that there are a lot of people in the UK with perfectly good reasons to send all sorts of suspicious looking emails. When the price of being flagged is a police interview (for starters) it really would be worth talking to the people who've been doing this stuff for ages - have a word with the analysts at Tesco Clubcard.

Tuesday, 20 January 2009

SAS in trouble?

I'm going to stick my neck out here about the piece of software that drives a lot of marketing analysts' work.

SAS is the industry standard software for analysing big databases and, in all honesty, it should be much better.

The fundamental structure for SAS was put together in 1966 - 1968, with SAS Institute being incorporated in 1976 and the problem today is that it feels like a piece of software that has been built up over time. It also feels like the core of SAS was never designed with all it does today in mind, so new features have been bolted onto older features as the need for them arose.

It's horrible to code for SAS. There's no inline error checking, no auto suggest and the way that SAS Macros work is counterintuitive if you've got any other programming experience. To cap it all off, features added at different times over the life of SAS have subtly different programming syntaxes, so you have to learn individually how every procedure works - it's not enough to learn the basic structure of the language.

Apart from being the industry standard, I say SAS should be much better because it costs £4,300 per seat, per year (ignoring multiple licence discounts.) That's a hell of a lot of money for a piece of analytical software - almost the same as ten copies of Office 2007 Professional. And once you buy Office, you own it for life.


SAS could shortly be in a lot of trouble. Data analysis is a perfect market for Open Source software, because so many people will have a genuine interest in creating it. There's a large pool of analysts and programmers (including a lot of academic researchers) who will be happy to add the features that they need and then make them generally available to everyone else.

R is an odd name for a piece of software that, over the last 6 months, has been mentioned to me by analysts and by clients as a potential SAS replacement. Download it. It's free and it's very, very good.

It won't replace SAS for everybody yet. Banks for example, have loads of legacy built up in SAS and need the backup and support of a multinational software company. For many others though, R is being looked at as a genuine SAS replacement.

This NY Times article is a really good read and has an interesting quote from SAS, regarding R.

“I think it addresses a niche market for high-end data analysts that want free, readily available code," said Anne H. Milley, director of technology product marketing at SAS. She adds, “We have customers who build engines for aircraft. I am happy they are not using freeware when I get on a jet.”

The thing is, most data analysts don't build jets. They do day-to-day tasks like financial reporting and creating customer segmentations.
When Google and Pfizer publicly admit to using R, I think it's time for SAS to worry. R has also gained a strong hold among academic researchers, which means the next generation of graduates joining the industry will know how to use it rather than (or as well as) SAS.

If SAS doesn't get its act together and produce some software that is £4,300 better than R, they're going to lose a lot of customers. And you know what? Most of those customers won't be sorry to see it go.